
GivingPulse
Q3 2023 Report
A holistic look at trends in giving behavior and perspectives
June - September 2023
Supported By:


Executive Summary
This is the first quarterly report from GivingPulse, a weekly US nationwide cross-sectional survey that tracks every form of generous interaction people took within 7 days of whenever they completed the questionnaire. We combine these behaviors with a spectrum of demographic and attitudinal traits to present a complete picture of who is donating time, treasure, talent, or influence and what motivates them to get, and remain, involved.
While this report covers Q3 of 2023, the complete survey data in its current format dates back to September of 2022, providing us with some context about which behaviors and traits are stable and which fluctuate. We also track this against world events and national disasters with the expectation that a longitudinal survey such as this will eventually be able to tease out the degree of influence that an evolving global context exerts on individual choices and patterns. We believe there is much insight to be gained about the nature of generosity and philanthropy at the intersection of behavior, belief, and situational context - both in the United States and eventually, worldwide.
These are our top 5 shifts in behaviors or perspectives from Q3 of 2023:

World Events: The Maui, Hawaii wildfire was the top concern for US citizens in Q3, followed by natural disasters in Morocco and Libya.

Financial Strain: Fewer of the high generosity group reported feeling financially strained in Q3 (59%), compared to Q2 (73%).

Guilty Motivation: Similarly, fewer of the high generosity group reported sometimes giving out of a feeling of guilt for "having so much" in Q3 (56%), compared to Q2 (79%).

Situational Giving: Reduced participation (between 8 and 16 percent less) in Q3, compared to Q2, in many contexts (in person events, via platforms, online direct to organizations, and directly to people in need).

Giving Groups: We find three groups of people, based on their generosity: There is a high generosity group that tends to plan ahead and favors automated donations, and a medium level generosity group that favors spontaneous acts of giving. The low generosity group is less involved than both.

The Report
Part 1
Forms of Generosity

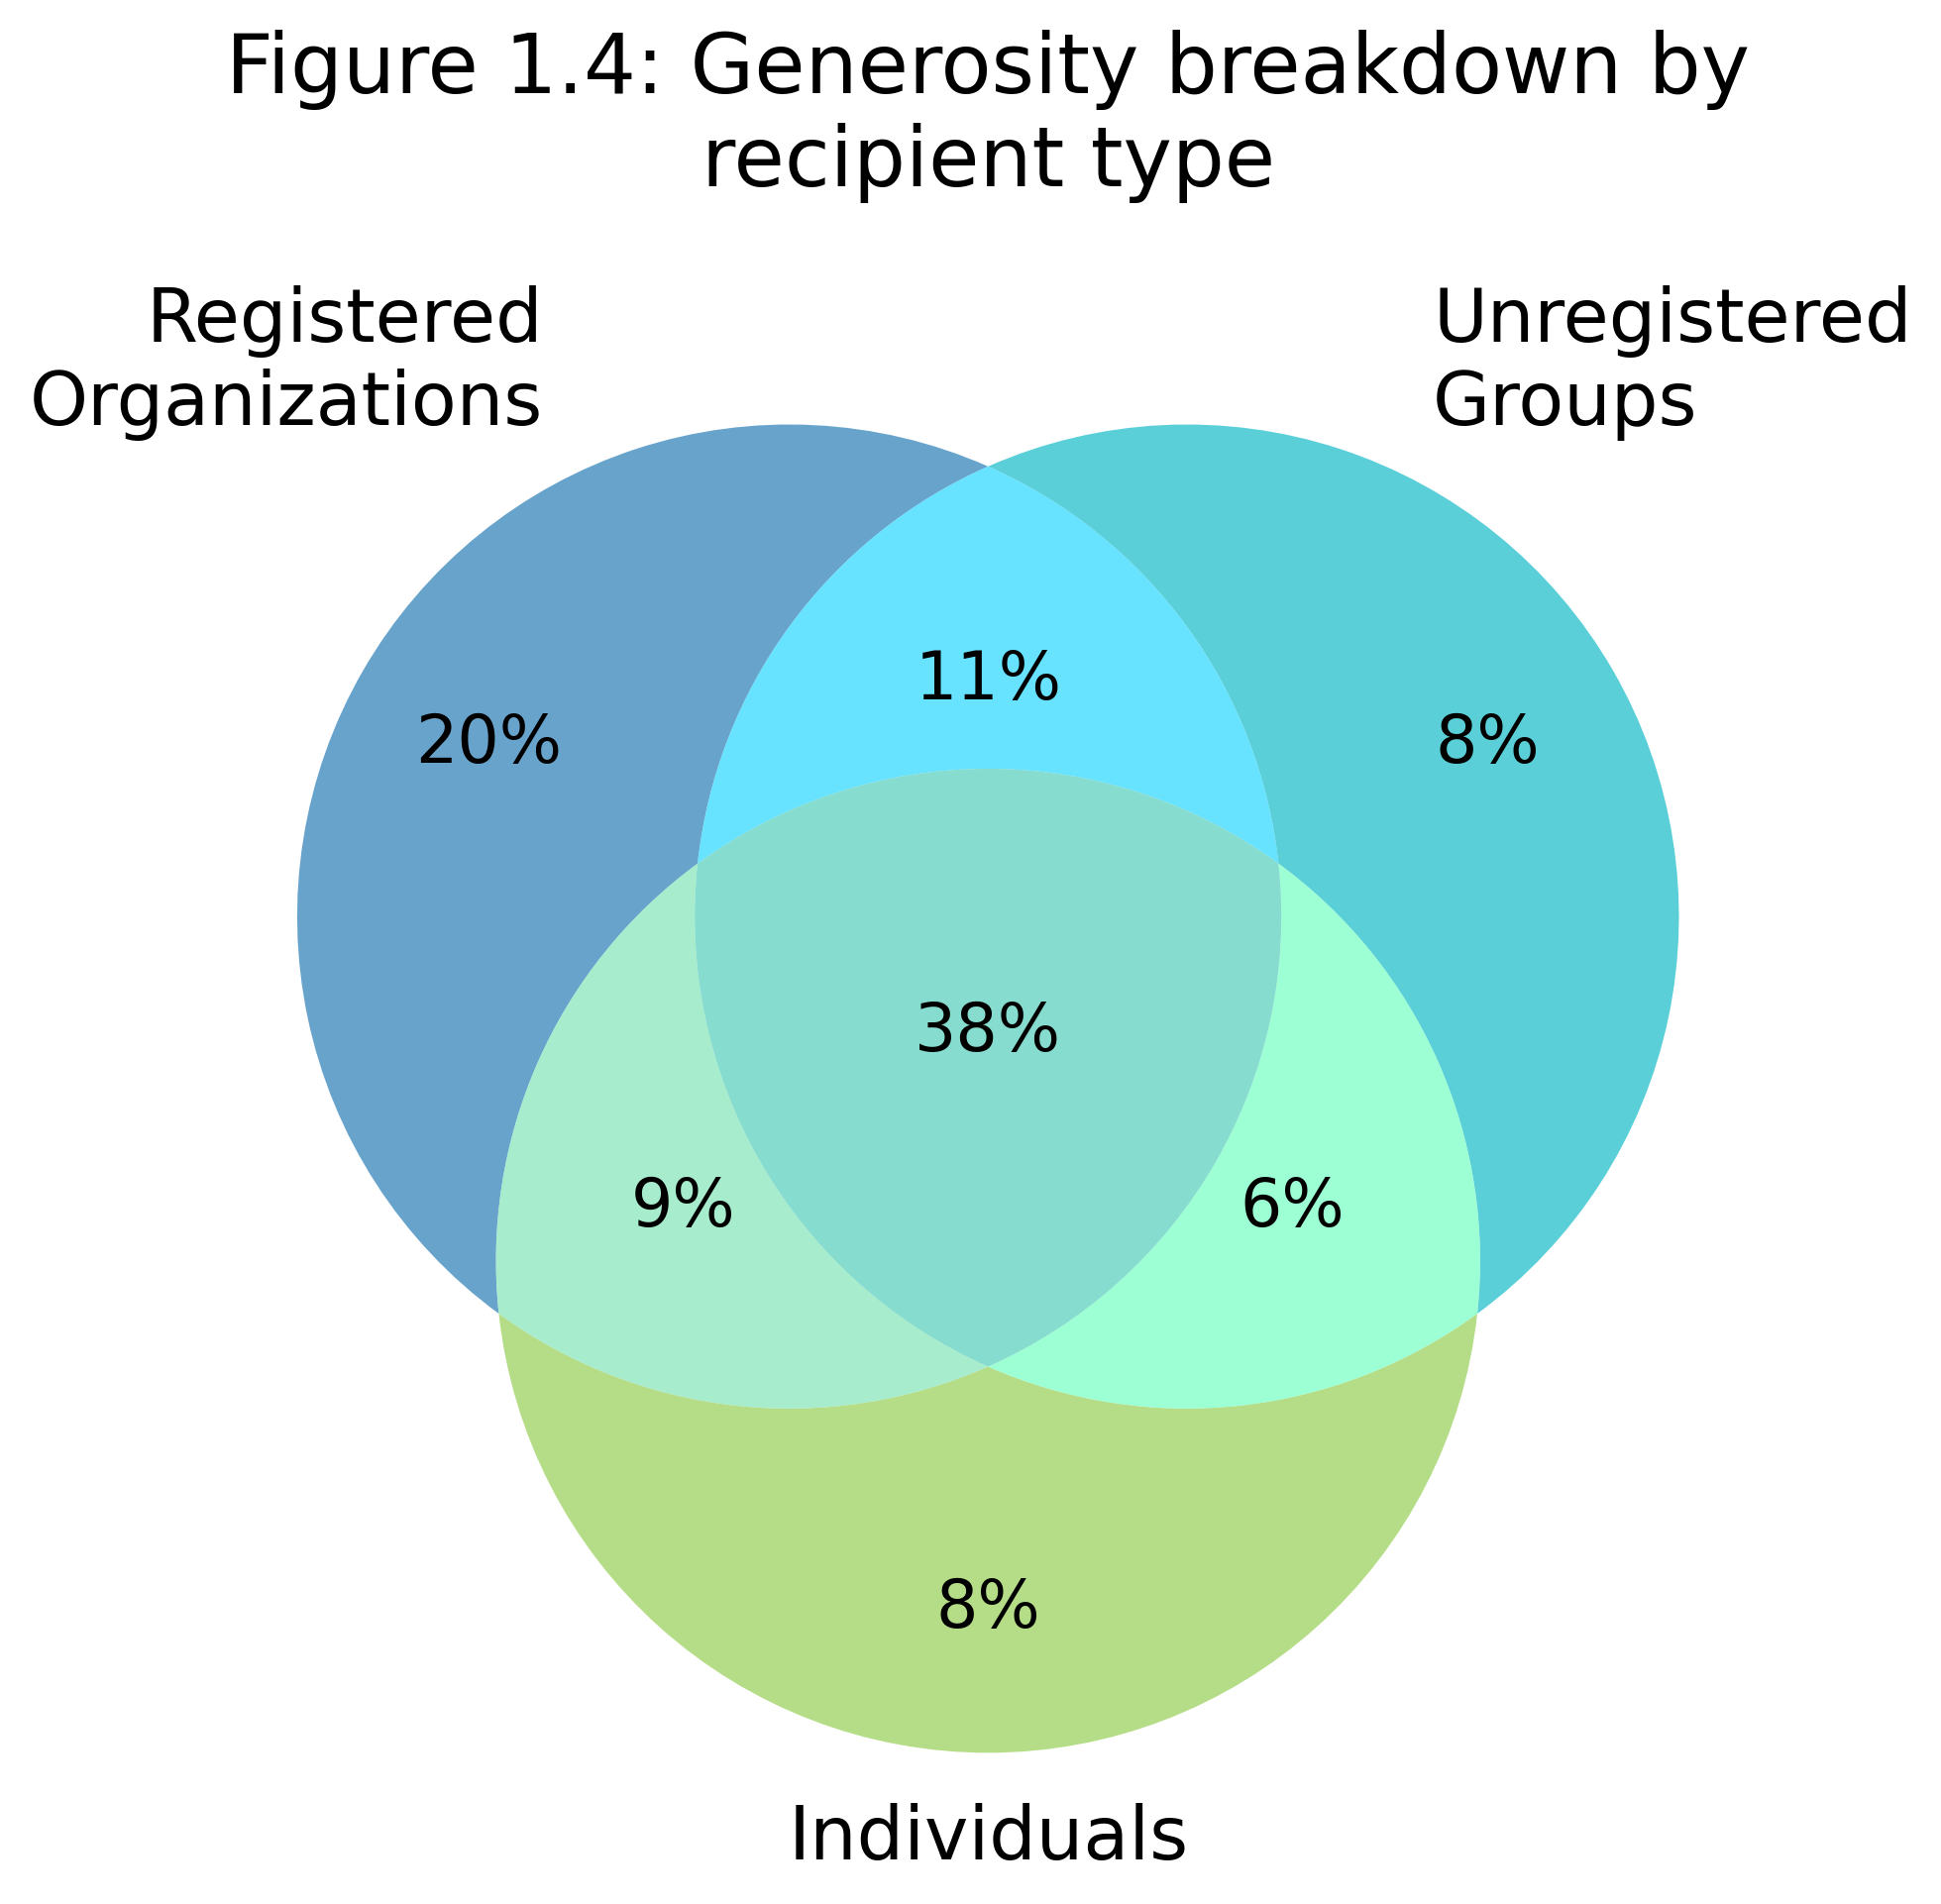
Each week, we ask 100 people across the USA what generous actions they undertook within the last 7 days, for a combined sample of 1200 people each quarter. These actions could include giving money, time (volunteering), items, or advocating for causes or groups1. We also ask people to distinguish whether they gave to a formal registered charity, some informal group, or an individual. Starting in the next quarterly report (Q4, 2023), we will also discriminate between giving locally, nationally, or internationally.
1. A fifth category,"Gave in other ways", includes donating blood/tissue or political donations.

Each of the major types of generosity are shown below on a 4-week rolling basis covering 2023 through Q3.

Givers of all three gift types typically form the largest subsegment of the population, although over the last few weeks of the quarter they are equally as prevalent as givers of items only. In Q3, monetary givers were the most variable week to week. The segment of the population giving money only trended downwards for the first six weeks of the quarter from 21% of givers to 11% of givers, while givers of items, items and time, and all three gift types trended upward, suggesting an emphasis on non-monetary giving in the first half of the quarter. Giving time only is generally one of the less popular subgenres of giving, but was particularly unpopular in Q3, with around 5% or less of givers giving only time in any given week. In general, people who give time tend to give in other forms as well, and this pattern is particularly noticeable this quarter. Overall, there is little quarter-over-quarter change in any one subgroup of givers.
The breakdown of respondents giving to different recipient types remains relatively stable throughout Q3. There was a slight boost (up to about 45%) in the proportion of givers giving to all three recipient types in September, but no dominant overall trend. Similar to gift types, there is little quarter-over-quarter change in any subsegment of givers to report.

Part 2
Generosity Profiles
Using combinations of all questions in the survey, we clustered respondents into three groups. Because most of the questions pertain to giving behaviors, these groups tend to be defined as low, medium, and high generosity groups.

Generally, the high generosity group prefers to set up automated giving and follows an annual budget or plan that supports formal charity organizations. The medium generosity group is more spontaneous in their giving, with this group being the most likely to have recently helped a person or organization without being asked. The low generosity group is the largest (52% of everyone in Q3 of 2023) and they collectively do a little of everything, with no one giving mode or behavior shared by a majority. The proportion of respondents in each group tends to vary a little from month to month, but the low generosity group is always the largest segment, comprising about half of the people surveyed.
Part 2.1
Behaviors that defined these groups in Q3 of 2023
While our clustering approach could segment people into groups based on any combination of attitudes and behaviors, we find that participation rates in all modes of giving to all forms of recipients (registered charities, informal groups, and individuals) are consistently highest for the high generosity group, across the giving modes we track. In addition, the more generous a group is, the more it tends to share a similar number of behaviors and attitudes. We itemized more than 200 behaviors and attitudes from our roughly 30 survey questions, and about 40% of the high generosity group participated in the behaviors and attitudes we track across the whole survey, compared to 20% of the medium group, and 11 percent of the least generous group - in Q3 of 2023. Below are the major differences in levels of engagement between these three groups.

2. We track workplace or employer related generosity using three questions at different points in the survey. People are counted who answered yes to any of the following: (1) "You are employed and have given to a charity, non-profit or community group automatically from your pay as administered by your employer" or (2) "In the past 7 days, have you participated in a workplace or employer-led drive for any items, money or volunteering" or (3) You sent money "via an employer as a payroll deduction" in the last 7 days.
Percents reported are the percent of each respective group that was involved with the activity.
Range of Variation: As a general measure of how much these measured traits and behaviors vary, we report which group had the highest variability in the first three quarters of 2023 and the range of quarterly averages we observed for that group over that time period.
Compared to the previous quarter, workplace giving was lower in the high generosity group, even though this is one of the distinguishing characteristics for this group (automated giving).
Fewer of the high generosity group donated through their workplace than in the previous three quarters (53% compared to 82%, 70%, and 64% in the previous 3 quarters).
One defining characteristic of the medium generosity group is that a consistent majority of them report that their most recent act of generosity was given without being asked each quarter (Q3: 59%, Q2: 68%, Q1: 49%, and 2022-Q4: 57%) – unlike the high generosity group (Q3: 46%, Q2: 39%, Q1:42%, 2022-Q4: 41%). While we cannot draw direct links between spontaneity and resulting recipient type, broadly speaking those who give spontaneously report giving on a peer-to-peer basis much more frequently and report giving money to registered non-profits significantly less than those who do not report spontaneous giving. In a similar localized survey that GivingTuesday conducted in March 2023 and involving 2,641 respondents residing in Florida, the equivalent medium generosity group was defined by this trait of recent unsolicited giving, so we labeled them the "Spontaneous Informal Givers."

It should also be noted that a smaller percentage of the medium generosity group was solicited within a month of when they took the survey (55%), compared to the high generosity group (69%), meaning that is it likely that fewer folks in the medium generosity group appear on targeted lists nonprofits use for outreach. Indeed, when asked whether they agree with the statement, "There are so many reminders, solicitations, and publicity for giving to nonprofits in day-to day life," the percent of each group that agrees is consistent with the medium and high generosity groups being solicited more frequently: 90% of the high generosity group agreed, compared to 86% of the medium generosity group and only 74% of the low generosity group (p<0.05).
Part 2.2
Demographic differences between groups

Most of the demographic characteristics we tracked (specifically geographic region within the US, gender, marital status, language spoken at home, employment status, and political alignment) did not vary significantly between groups. We saw clear differences in income, religiosity, and age that correlated in expected ways with the amounts people reported giving in the past year, based on other research.
We also observed that African American participation in Q3 was 30% higher compared to Q2, and this shift in sample likely accounts for the relative increase of African Americans in the high generosity group compared to the other giving groups. Otherwise, ethnicity was not dramatically different between groups in previous quarters. 4

4. Religious people give more: https://philanthropy.iupui.edu/news-events/news-item/religiously-affiliated-people-more-likely-to-donate,-whether-to-place-of-worship-or-other-charitable-organizations.html?id=241 Income correlated to greater generosity: https://philanthropy.iupui.edu/news-events/news-item/affluent-americans-gave-48-percent-more-on-average-last-year,-finds-2021-bank-of-america-study-of-philanthropy.html?id=370 .
5. These ranges are illustrative of the magnitude of differences between the groups, but are not precise averages. We ask respondents how much they donated over the last 12 months using a multiple choice question with twelve dollar value ranges, and bins increase in size for larger donation levels. Furthermore, 12-month recall is methodologically prone to greater uncertainty than 7-day recall
(https://www.ncbi.nlm.nih.gov/pmc/articles/PMC7688156/). To estimate, we used the lower bound donation value of each bin and weighted it by the number of respondents in each group selecting that option.
6. Non-white includes any combination of ethnic identities that did not include "Caucasian/White". This is mutually exclusive with "White (only)". Possible choices were: African American, Caucasian/White, Hispanic/Latino, Asian, Eastern or Central European, Indigenous/ Native/First Nation or Other.

Part 2.3
Attitudes about Giving: Percent who agree with each statement

More of the high generosity group seems to express feelings of guilt over good fortune and experience peer-pressure to give compared to the low and medium generosity groups. However, this influence diminished in the recent quarter. 79 %of the high generosity group reported giving out of "guilt" in Q2 of 2023, compared to 56% in Q3.
Part 2.4
Attitudes about Nonprofits: Percent who agree with each statement

Compared to the previous quarter, the high generosity group differed in several ways:
In Q3, less of the high generosity group reported feeling financially strained (59%) versus in Q2 (73%).
A much lower percentage of the high generosity group reported trusting nonprofits (67%, compared to 78% last quarter).
These changes might be due to other factors not accounted for in the questions we asked, or changes in the circumstances in Q3 of 2023 affecting typically highly generous givers.
Interestingly, there was no difference between agreement with the statement "Giving to nonprofits is full of unknowns.": 67% of the low and high generosity groups agreed, compared to 57% of the medium generosity group.
Part 3
Highlights From Last Quarter
Part 3.1
Specific Crisis Awareness and Response

The Maui, Hawaii wildfire was the top concern for US citizens in Q3. Natural disasters in Morocco and Libya also appeared in the top 20 topics, while the Ukraine War was pushed down into 32nd place.
Note that although the Israel-Hamas war broke out on October 7, 2023 – which is in Q4 – early analysis of our Q4 data shows that 28% of all "emergency situations" mentioned by respondents in October 2023 referred to the Israel-Hamas war (making it the top crisis for that month).

When considering these top concerns for US citizens in Q3, 42% of people either responded or intended to respond to a recent crisis they were aware of, compared to 49% in Q2. This quarter we saw a drop in the proportion who "already responded" (18% in Q3 versus 31% in Q2) and a corresponding increase in the proportion who were not sure if they will respond to the crisis they identified (42% in Q3 versus 33% in Q2).

Part 3.2
Workplace Giving
Automated donations through payroll deductions or other employer-managed philanthropy was down 3.2 percent in Q3 (11.1% participated), compared to the previous quarter (when 14.3% participated).
Overall, 7% of respondents used employer auto-deductions and 10% of respondents had active auto-deductions from their bank accounts in Q3. These rates are consistent with those seen in previous quarters. 11% of respondents started supporting a new organization or group within the last 7 days of when they were asked.

Part 3.3
Solicitation and Response
In general, we find that 40-45% of all respondents had been solicited within a month of taking our survey, and that about a quarter of them responded with some act of generosity (10% of the overall sample). Interestingly, a quarter of all respondents had been asked within 7 days of when they took the survey.


If we look at respondents who did not report performing any act of generosity within the last 7 days (about a third of all respondents), we find that this group was also about half as likely to have been solicited in the past year.

Part 3.4
Donation Methods
Giving cash directly to a person in need was the most common donation method in Q3 of 2023, followed by online direct donations to nonprofit organizations and in-store collection.


Rates of use for donation methods were similar to the previous quarter, varying only by +/- 3 percent. Of these, the biggest decline in use was transferring cryptocurrency and text message / mobile phone payments.

Part 4
Trends

Analysis
In our analysis, we defined Major Donors as people who reported giving at least $2500 last year. This provided us with sufficient sample-size for trend analysis and still represents the most generous individuals. We set our threshold for whether a particular metric was trending up, down, or remaining the same to be a +/- 10 relative percent change from the previous quarter's average. We show absolute differences in the percent in the table and the range of values over the last three quarters to give a sense of how stable/variable each metric is.
Part 5
Other Trends:
Contrasting Givers and
Non-Givers
In each quarterly report, we will take a closer look at one specific segment of the overall GivingPulse data. In Q3 of 2023, we decided to focus on what differentiates people who gave in any form (money, volunteering, items, advocacy) from those who did not give in any form.
Part 5.1
News About Charities
Positive charity buzz may be highly sought-after by nonprofit organizations, but it turns out that getting any news and awareness of causes and organizations is really what matters. In our quarterly data, we often see that givers (as a group) are more aware of both positive and negative charity news. Non-givers (as a group) tend to be half as likely to have recently heard anything positive or negative about a charity. Numbers shown on trend lines are the net change in either positive or negative awareness over the Q3 of 2023.

Part 5.2
Solicitation
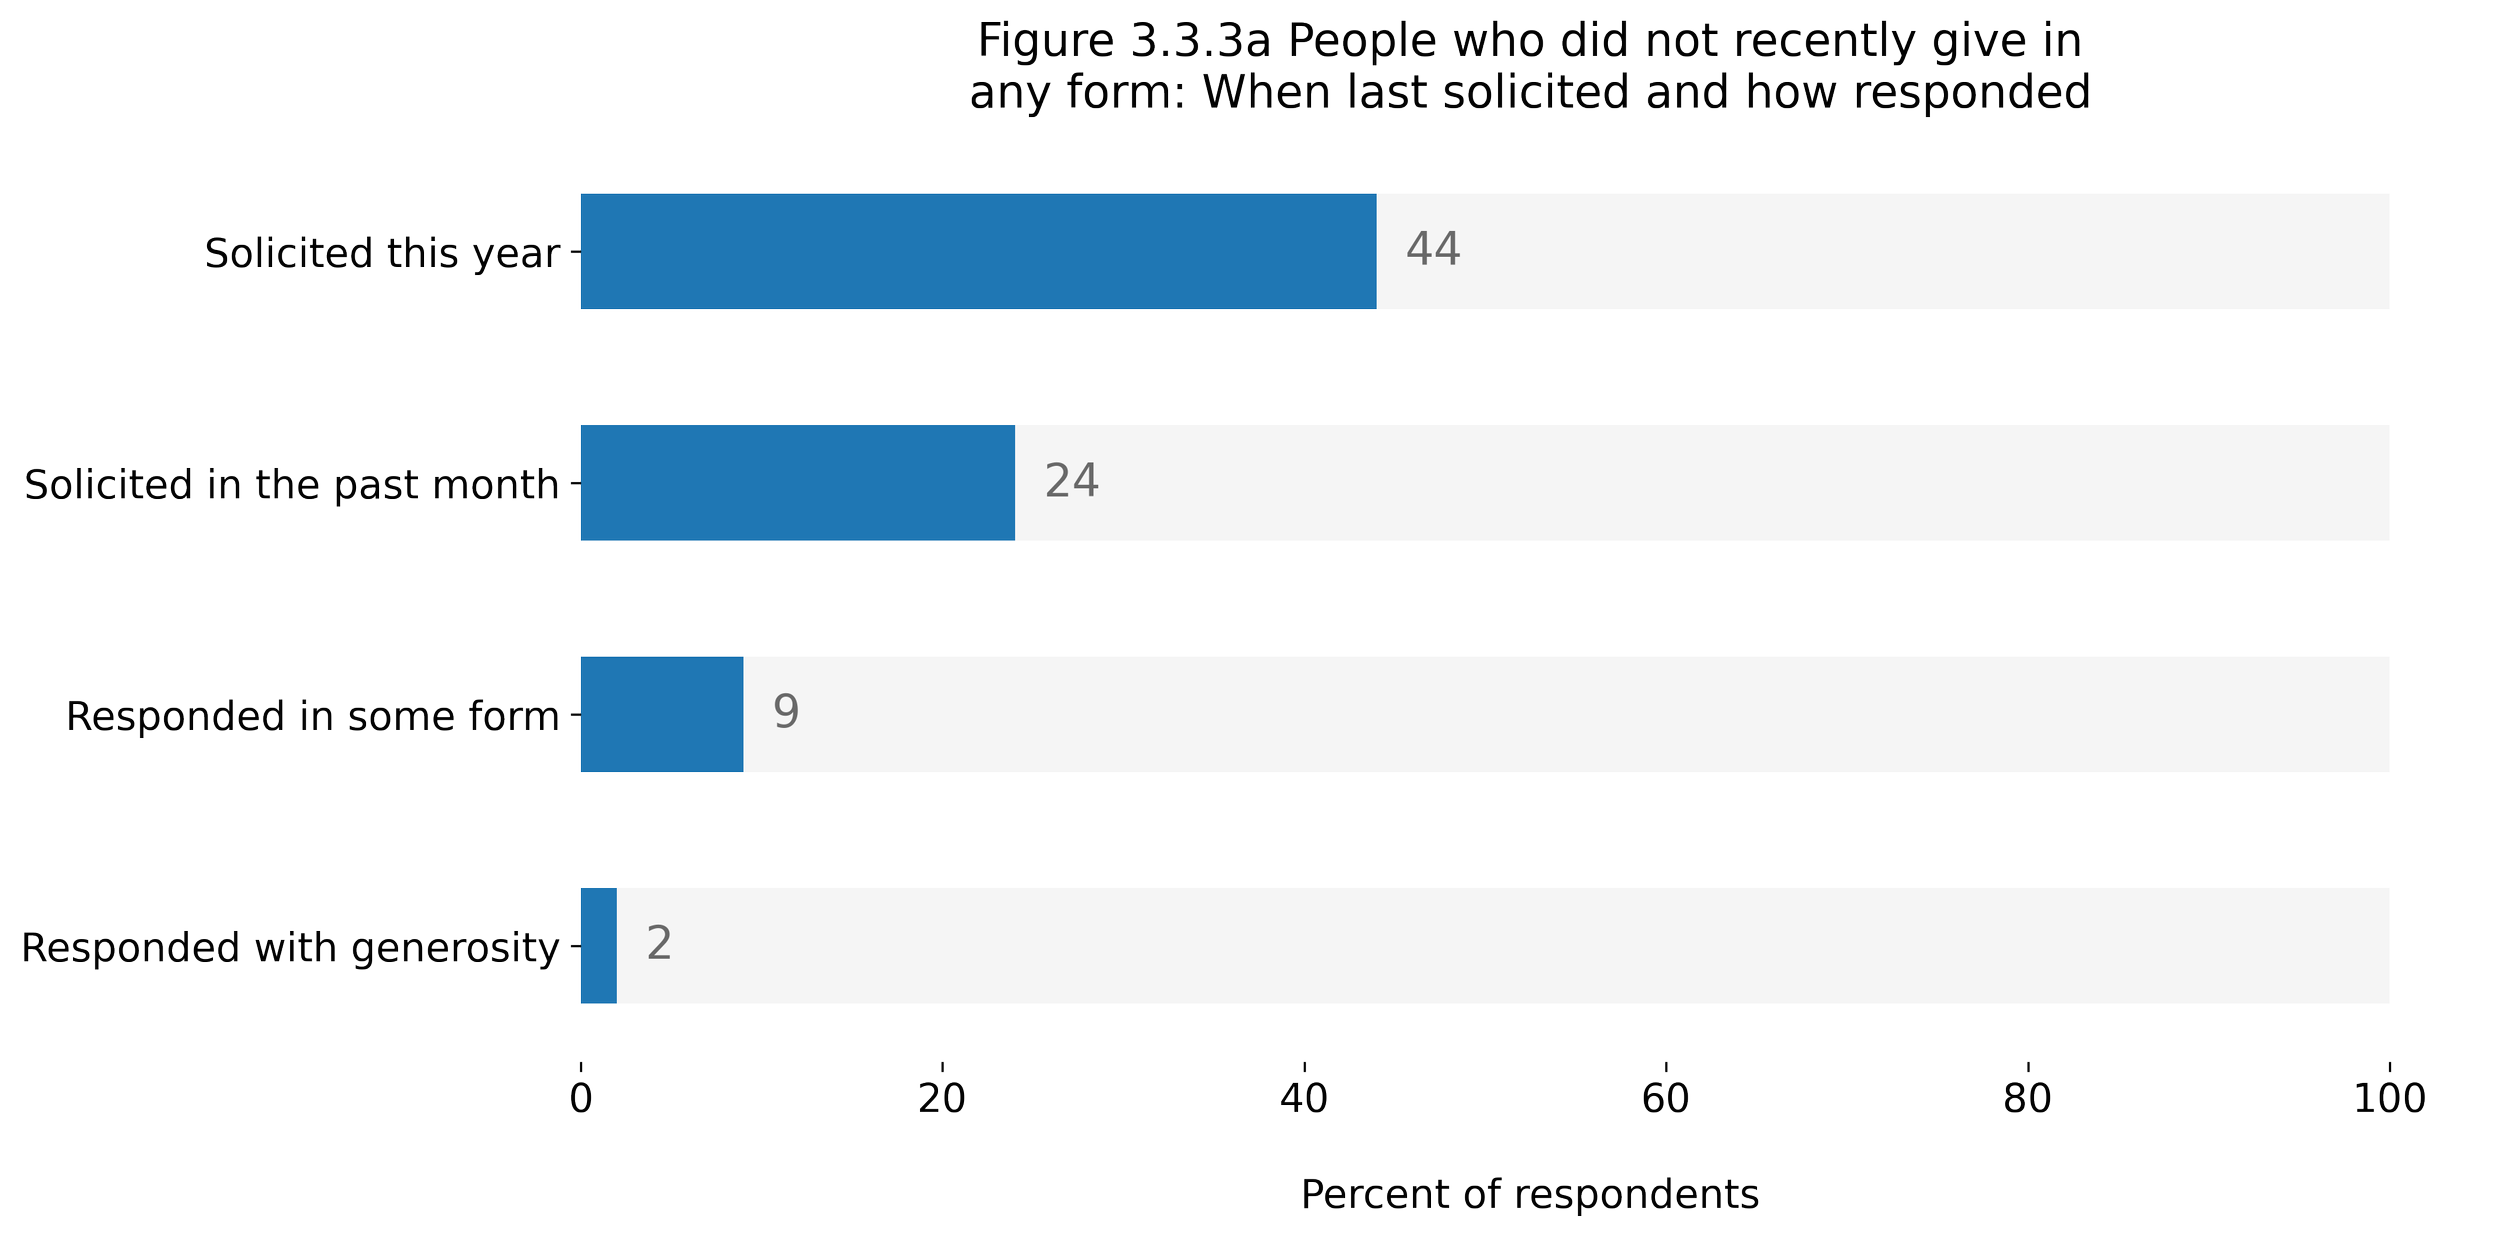
People who had not given within 7 days of being asked to take our survey are not a homogeneous group. About half of them (56%) had not been asked in the past year to give, or could not recall the last time they'd been asked. Only a quarter had been asked in the past week or month. In contrast, 54% of givers (people who'd recently given in some form) had been asked to give within the last month.

People who had not been solicited in the past year also had a host of other traits that differed from the overall sample: They tend to skew older (fewer 30-34 year-olds, more 50-85 year-olds), have less disposable income, are less religious, majority female, are more likely to be unemployed or retired, and had lower annual incomes. In particular, a majority of the unsolicited (51%, 53%, and 54% for Q3, Q2, and Q1 respectively) donated between $50 and 99 in the previous year, compared to about a third of the overall sample (31%, 31%, and 32% in Q3, Q2, and Q1 respectively). These traits and trends were consistent in the first three quarters of 2023.
Part 5.3

Spontaneous givers and planners
People in our survey tended to approach their most recent act of giving either with forethought (11.5%, as part of a plan or within a budget), or they decided in the moment (14.5%, spontaneous giving). We only found slight differences between these groups in how recently they'd been last solicited, whereas nongivers as a group tended to have been solicited less recently.

On the whole, spontaneous givers give almost twice as frequently as the average respondent. They are also more than twice as likely to have given cash at a recent live event, compared to other respondents. As a whole, they overwhelmingly enjoy giving, think everyone has a duty to help, find it easy to give, and feel there are many reminders to give (each statement was supported by 84-94% of spontaneous givers).

Part 6
What's In Store For Q4 of
2023
The next quarterly report will both cover trends in the Q4 of 2023 and wrap up some key trends observed over the whole year, including:
Detailed giving trends for the whole year: Our next report will incorporate data on 2023 giving season, and how trends have been affected by what is normally a crucial time for the social sector.
GivingTuesday event awareness in 2023, compared to other giving days: We’ll have more insight on awareness of GivingTuesday over the course of this year’s giving season, and provide early indications of where nonprofit organizations can leverage the GivingTuesday momentum.
Crisis awareness over all of 2023, with a detailed look at people who supported the top crises. The next report will provide a more granular exploration of how different respondents react to and support the crises that were top of mind.
Analysis of slight questionnaire rewording on trends: We’ll explore what we’ve learned from changes we’ve made to the GivingPulse questionnaire and how it impacted our reporting on key trends.
How one's worldview and self-identity maps to generosity groups: Looking back on 2023, we will introduce our analysis of how key beliefs around major issues maps to way they give and support organizations they care about.
Analysis of relationships between different types of giving: Our next report will document what we’ve learned about how different kinds of giving (i.e., money, time, items, or advocacy) relate to each other. These data will serve as useful starting point for organizations seeking to build community among their supporters.
Part 7
About The Sample


Regional variation:
The overall sample was balanced across four US geographic regions (South, Northeast, Midwest, and West). We see many more major donors (people who gave $2,500 or more last year) in the Midwest (48% increase compared to previous quarter). Workplace givers were 31% more prevalent in the Northeast this quarter, compared to last.
Demographics:
Other demographic shifts, compared to the previous quarter: African American +30; White -4; Hispanic/Latino +19.
We noticed a drop of about 10 percent (from 80% to 70%) in the fraction of self-identified white people among givers this quarter, but percent of white non-givers remains steady at 80%.
Employment:
35% of non-givers are employed, compared to 45-50% of givers. Similarly, 20% of non-givers are unemployed, compared to 10% of givers.