GIVINGPULSE
Year in Review
2025
A holistic look at trends in giving behavior and perspectives in the U.S.
Table of Contents
Part 1: US Generosity in 2025
Overall patterns of generosity
Crisis and news awareness and participation
How generosity affects perceptions of financial strain
Part 2: Towards understanding the social fabric
-
Since 2022, GivingTuesday has conducted a weekly cross-sectional online survey of Americans that tracks generous actions in the past week and their associated attitudes and worldview. These findings relate to the year of 2025, and build on findings we’ve been publishing throughout the year.

Summary
US Generosity in 2025
The story of American generosity in 2025 is not one of decline, but of resilience under considerable pressure. Despite economic anxiety, political turbulence, and a continuously shifting media landscape, Americans were slightly more generous than the year before. Monetary giving, item donation, and volunteering each ticked upward. Registered charities remained the dominant recipient of individual generosity, though significant numbers of people express it through informal groups and individuals as well.
The most powerful driver of American generosity isn't wealth or willingness – it is whether people remember being asked to participate. As was the case in 2024, half the country can’t remember being solicited.
Awareness matters just as much. People who knew about a crisis, or who had heard anything about a nonprofit, whether positive or negative, gave at substantially higher rates than those who had not. In a media environment that is fragmenting and contracting, this finding has real stakes. Sustaining generosity may depend, in part, on sustaining the information ecosystem that makes need visible.
Taken together, the 2025 data make a case that generosity in America is less fragile than headlines suggest, and more responsive to conditions that we can actually influence.
“What the 2025 data makes clear is that awareness is the engine of generosity. Whether people heard about a local crisis, someone in their community doing good work, or were simply invited to make a difference, they responded. We need to make sure that those signals keep reaching people, especially as the media landscape shifts.”
Highlights
65% of Americans gave in some form in 2025, which is slightly up from the year before, despite economic turbulence. Monetary giving, volunteering, and item donation all ticked upward — a sign that generosity held its ground in a difficult year.
Half of Americans don’t remember being asked to give. Solicitation rates held at between 45–55% over the course of the year, which is unchanged from 2024. Our earlier research suggests that increasing outreach could unlock between $19 billion and $46 billion in annual giving.
Among those who were asked, 87% gave money, which is up 6% points from 2024. Separately, the monetary amount people report giving appears stable across a variety of income levels.
Exposure to negative nonprofit news was associated with more giving, not less. The data suggest that attention to the nonprofit sector — no matter what prompted it — is itself a signal of civic engagement.34% of people report having a real sense of community belonging, while 59% have an ambiguous relationship with their community and 7% feel no sense of belonging. Among those with a sense of community belonging, 72% recently gave in some form.
Helping across differences is broadly embraced: 55% agree and 25% strongly agree that they support others regardless of differing beliefs, politics, or lifestyle.
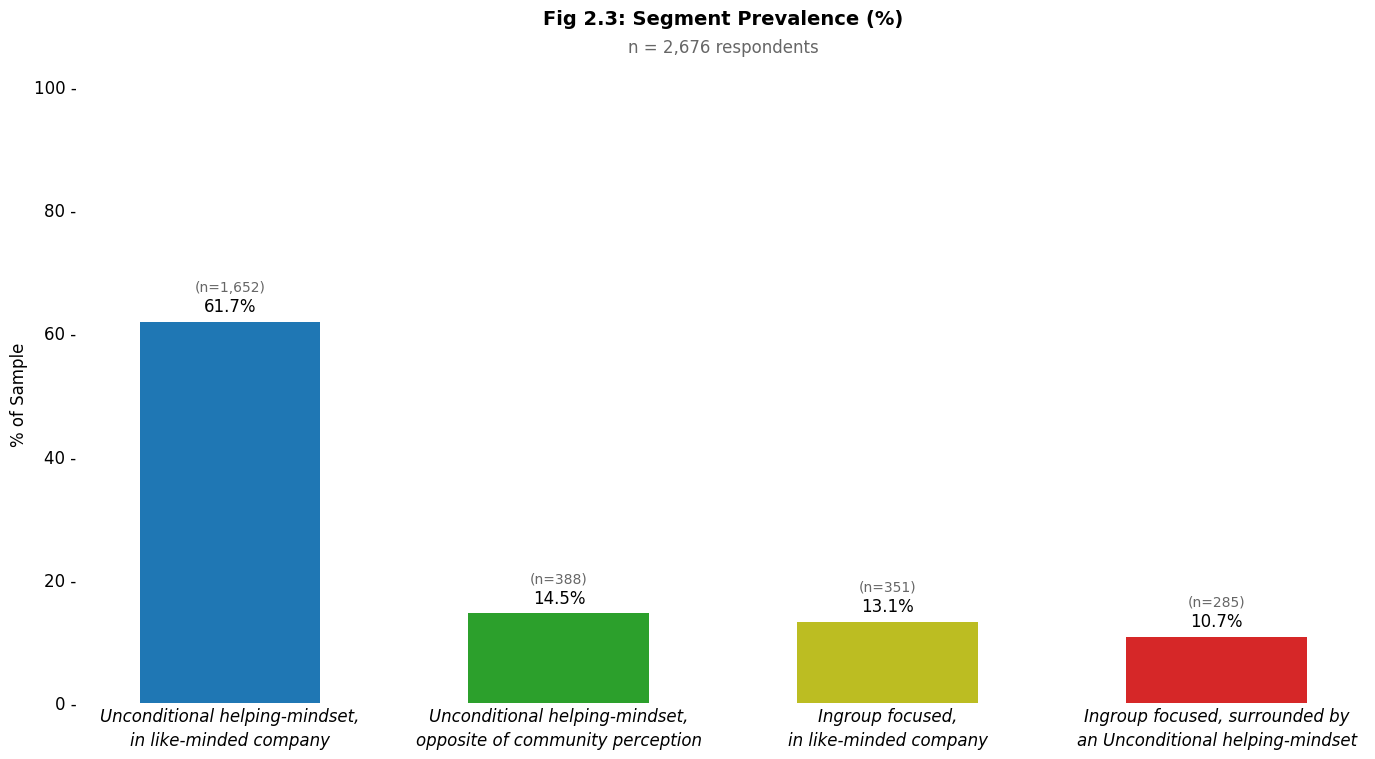
61% strive to build community and also perceive others in their community are doing the same.
Across US community types in different geographies, a vast majority of respondents (ranging from 83% to 95% in different areas) believe others around them are willing to help.
The social fabric: Trust, community belonging, depolarization, and prosociality
Much of the 2025 media narrative framed division and tension in the US as fraying the social fabric. Research from GivingTuesday’s Data Commons — which tracks people’s sense of trust, belonging, and willingness to help others — shows that many of these attitudes held firm in 2025, even if conditions for them were eroding.
GivingPulse, GivingTuesday’s weekly survey of generosity-related attitudes and behaviors in the US, shows that across 2025, three-quarters of respondents said they felt welcomed and included in their communities. These feelings correlate with broader trust measures in GivingPulse: a majority of respondents say they trust other people. Despite this, a majority continues to report feeling an ambiguous sense of community belonging, defined as whether they feel fully welcomed, included, and able to authentically belong. Those that feel a strong sense of belonging are more likely to take generous actions.
In an era characterized by political division, almost all respondents said they are willing to support others in need, regardless of differing beliefs, politics, or lifestyle. Similarly, a large majority feel personally invested in civic life, believing their actions can build a better society. Most respondents are striving to build community, and believe their neighbors are doing the same. Across different community types in the US, a large majority believe their communities are inclined toward care.
To get the most out of this report, consult our available data resources.

PART 1: US Generosity in 2025
Overall patterns in generosity
| Giving Type |
2024 (n=6,301) |
2025 (n=5,309) |
YOY Change (2025 − 2024) |
|---|---|---|---|
| Gave in Any Form | 63.8% | 65.4% | +1.6 pp |
| Gave Money | 36.4% | 39.2% | +2.8 pp |
| Volunteered | 24.5% | 26.4% | +1.9 pp |
| Donated Items | 38.0% | 40.6% | +2.6 pp |
| Advocated | 21.3% | 20.2% | -1.0 pp |
Generosity held steady through most of 2025 — then surged. Giving money, donating items, and volunteering all climbed in Q4, with participation rising by roughly 5% between Q1 and year-end.
These findings were not limited to more formal indicators of generosity. 77% reported performing a recent random act of kindness, a signal that prosocial behaviors run deeper than what other metrics capture. We’ll explore that connection between everyday prosocial behavior and more formal giving in future research.
| Metric | Q1 (n=1,296) | Q2 (n=1,305) | Q3 (n=1,356) | Q4 (n=1,352) |
|---|---|---|---|---|
| Gave money | 37% | 37% | 40% | 42% |
| Volunteered | 24% | 25% | 27% | 30% |
| Donated items | 38% | 37% | 43% | 44% |
| Advocated for a cause | 21% | 19% | 19% | 22% |
| Gave in any form | 62% | 64% | 68% | 67% |

Trends, seasonality and changes over previous year
As was the case in previous years, generosity follows a predictable pattern. It bottoms out in July and peaks at year-end, driven by a combination of factors including the holiday season, GivingTuesday, and year-end tax deadlines.
One in eight Americans gave money, donated items, and volunteered recently. These aren't three separate populations, but the same highly engaged people showing up across every form of generosity simultaneously.
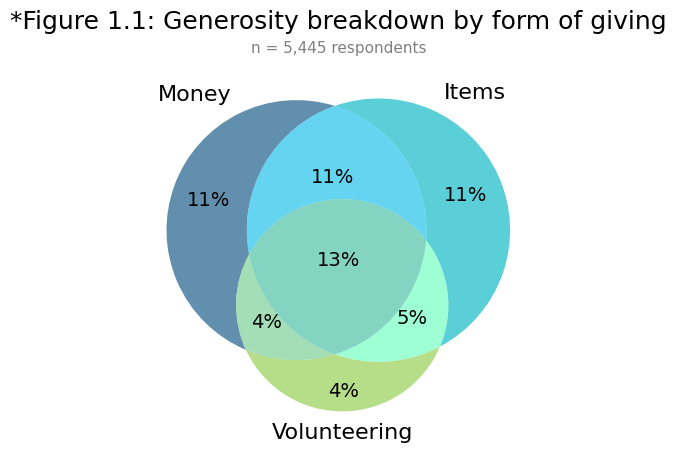
Overall giving rates in 2025 were virtually unchanged from 2024. The share of people donating money, items, or volunteer time in any combination and the share supporting registered organizations, informal groups, or individuals each varied by about 1% point year over year.
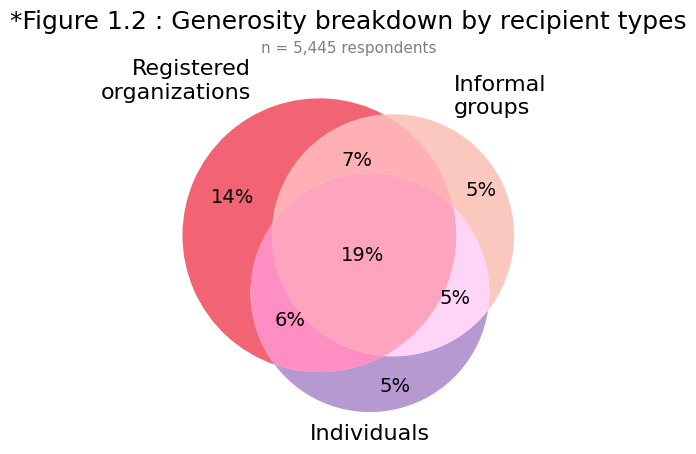
Among those who donated money, 81% gave to registered charities, compared to 60% who gave to informal groups or individuals, indicating that while formal charities garner the most monetary support, significant numbers of people support causes and people outside the formal non-profit sector. Just over half of all monetary giving remained within one's local community.
| Recipient Type | % of Money Givers (2024) | % of Money Givers (2025) |
YOY Change (2025 − 2024) |
|---|---|---|---|
| Registered charities | 79% | 81% | +2 pp |
| Solicited (past month) | 68% | 66% | -2 pp |
| Individuals | 65% | 63% | -3 pp |
| Informal groups | 60% | 60% | -0 pp |
| Cause | % of Money Givers (2024) | % of Money Givers (2025) |
YOY Change (2025−2024) |
|---|---|---|---|
| Rights | 37% | 34% | -3 pp |
| Poverty | 33% | 32% | -1 pp |
| Health | 31% | 31% | +0 pp |
| Earth | 21% | 23% | +2 pp |
| Society | 16% | 20% | +3 pp |
| Crises | 15% | 17% | +2 pp |
For people who gave money, the percent supporting different cause areas remains consistent from one year to the next, varying by at most +/- 3% YOY. “Rights” is the most supported cause (34%), slightly outpacing “poverty” and all other issue areas in 2025.
Solicitation rates and response rates
As we have seen in previous years, half of Americans were not asked to give. Solicitation rates (which measure respondents’ recollection of being invited to participate) held at between 45% and 55%, largely unchanged from 2024. The rate at which people responded to those solicitations remained steady for most of the year, but rose in early November. The largest share of people responding positively to solicitation occurred in the first week of December, the week of GivingTuesday.
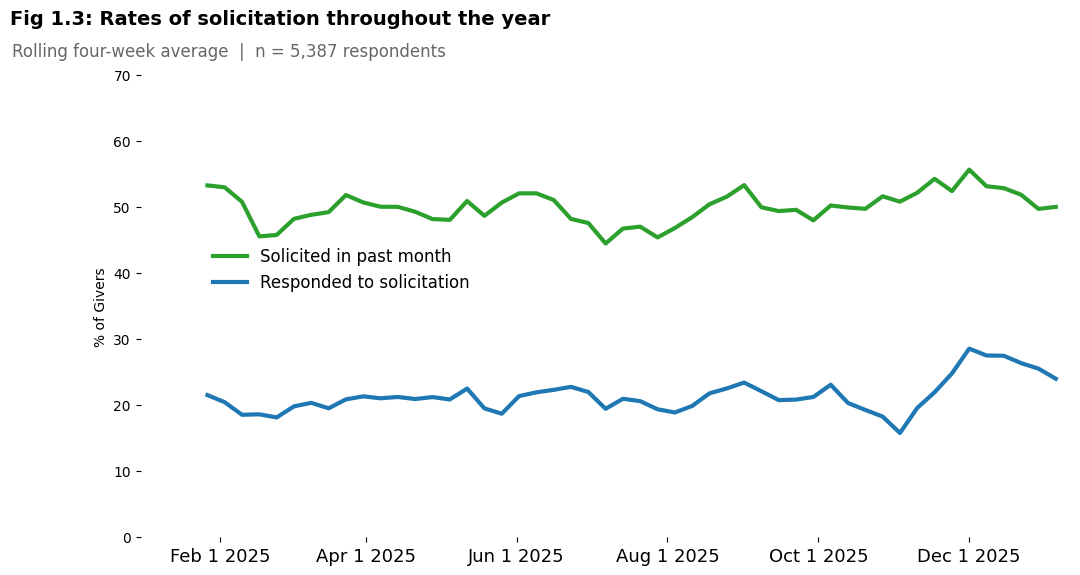
As we have noted earlier, our Growing Giving research puts the unlocked giving potential at $19 billion to $46 billion annually.
When people are asked, they give. In 2025, solicited Americans were more likely to give money than in 2024. Among those solicited, monetary giving jumped 6% points over 2024, while overall giving across every form held strong.
| Giving Type |
2024 (n=660) |
2025 (n=562) |
YOY Change (2025 − 2024) |
|---|---|---|---|
| Gave in Any Form | 96.4% | 97.2% | +0.8 pp |
| Gave Money | 80.6% | 87.0% | +6.4 pp |
| Volunteered | 44.5% | 44.7% | +0.1 pp |
| Donated Items | 58.3% | 60.5% | +2.2 pp |
| Advocated | 40.3% | 37.2% | -3.1 pp |
Median donation size and annual income remain stable across income groups
In a time of considerable economic anxiety, Americans appear to be giving consistent amounts of money. We asked people who say they donated money in the past week to estimate how much they gave. The median weekly donation held at $50 across every quarter of 2025, which is unchanged from 2024. Donation amounts rise predictably with income: those earning under $75,000 gave $25–$30 per week, mid-income earners gave $40–$50, and those earning over $150,000 gave $80–$100. Lower-income donors also gave slightly more in Q2 and Q3 than they did the year before.
No changes in self-reported volunteer hours
About a quarter of people volunteered recently, contributing a median of 4 hours in the past week (n=1,435), consistent with 2024.
Giving rates in 2025 were essentially unchanged from 2024, with all participation measures shifting by only about
one percentage point year over year.
Activism in 2025
In 2025, GivingPulse started tracking how often people participate in various forms of activism. These include both "passive" and "active" forms of participation. A forthcoming report will explore the attitudes that inform participation in activism in more detail.
In our dataset, we characterize passive acts as inclusive of:
speaking out on social media;
wearing a statement button or posting a yard sign;
signing a petition.
Active forms include:
showing up to a protest;
attending a political or issue rally in person;
contacting one's elected leaders about an issue.
Recognizing that a few people do even more, we also asked people if they engaged in any leadership-level forms of activism including:
speaking at a public assembly or event;
initiating legal action against some policy, person, or law;
civil disobedience.
Rates of participation in all these forms of activism were mostly stable over 2025, when calculated on a quarterly basis — with a few exceptions. All forms of activism — except boycotts — peaked in October 2025, while online advocacy steadily increased throughout the year (from 14% in Q1 to 19% in Q4).
Others¹ who study historical protests argue that mobilization involving at least 3.5% of the population is correlated with significant political change. GivingPulse data show that in total, between 3.6% and 5.8% of the population in 2025 in the US has taken part in a protest activity. Given that this is the first year these behaviors have been tracked in GivingPulse, we cannot claim whether this activity grew when compared with previous years.
About a quarter of the respondents engaged in some form of passive activism each week, but only about half as many participated in boycotts or petitioning over that time
There is a correlation between people who engage in activism and who also participate in generous actions. The highest correlation was between any form of activism and advocating for a cause locally. Boycotting was the only form of activism that had a near zero correlation with participation in generous acts.
¹Several groups have looked into this question, of how large protests need to be to result in system change. Chenoweth and Stephan (2011) arguethat most successful movements have mobilized 3.5% of the population in active engagements.
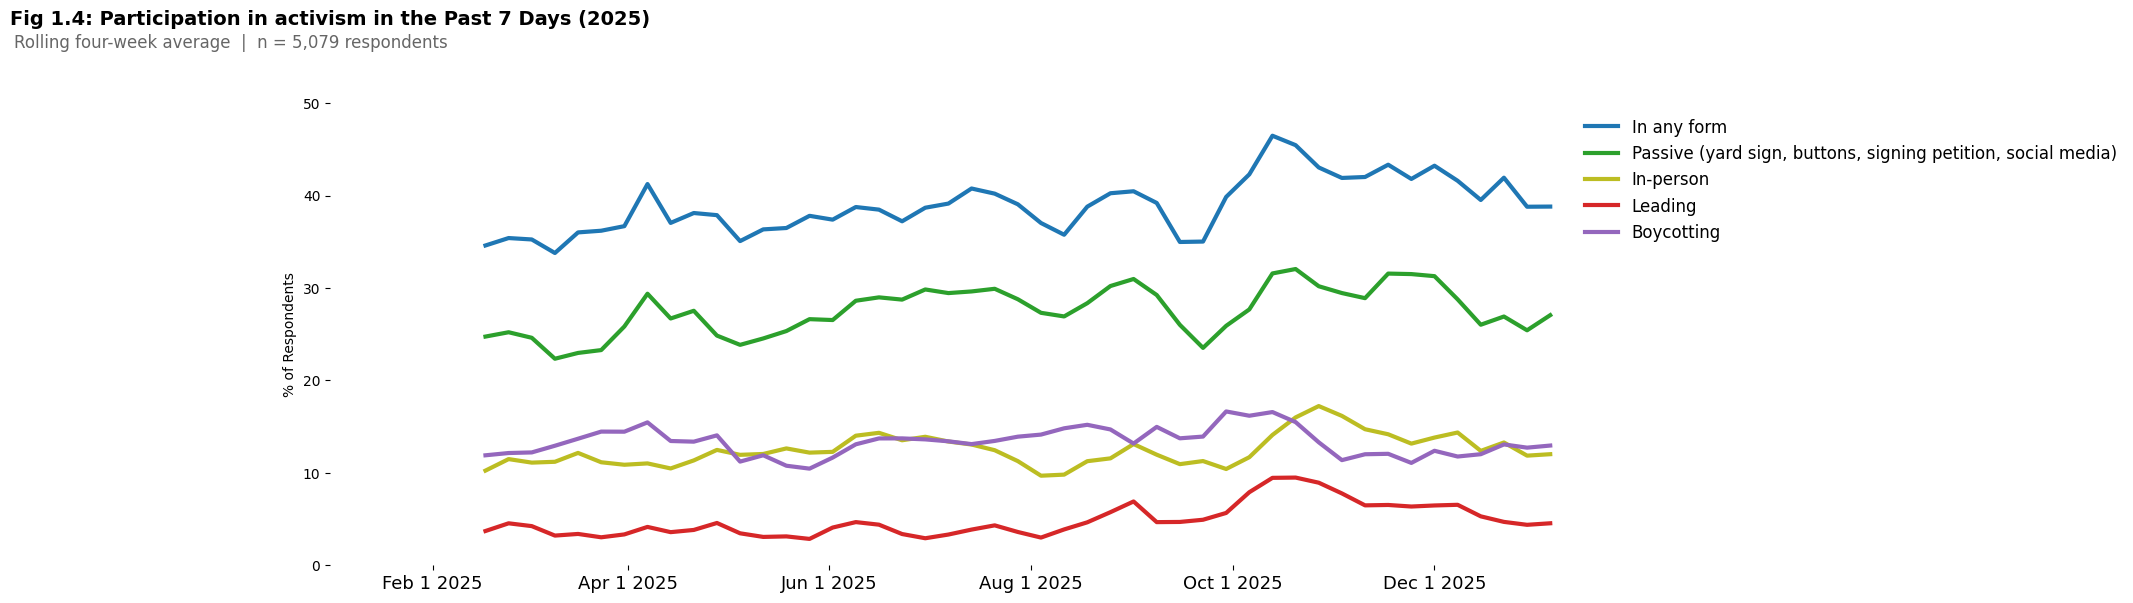
Activism, when broken down by specific activity, shows the average rate per quarter is steady throughout the year.
| Activism Type | 2025-Q1 | 2025-Q2 | 2025-Q3 | 2025-Q4 |
|---|---|---|---|---|
| Advocated online (n=880) | 14.4% | 15.6% | 17.5% | 18.7% |
| Boycotted (n=682) | 11.5% | 12.5% | 14.5% | 12.8% |
| Petitioned (n=688) | 11.3% | 13.8% | 13.5% | 13.2% |
| Contacted (n=352) | 6.2% | 7.0% | 6.4% | 7.0% |
| Protested (n=226) | 3.2% | 3.8% | 4.1% | 5.8% |
| Displayed signs (n=249) | 3.9% | 4.9% | 4.4% | 5.5% |
| Attended Rally (n=205) | 2.9% | 4.1% | 3.2% | 5.2% |
| Spoke out (n=180) | 2.8% | 2.5% | 3.5% | 4.7% |
| Civil Disobedience / Legal Action (n=78) | 0.8% | 1.0% | 2.3% | 1.7% |
65%
of Americans gave in some form in 2025
50%
of Americans don’t remember being asked to give
31%
of aware respondents responded to crises with generosity in Q4.
Crisis and News Awareness and Participation
Those aware of natural disasters, crises, and of nonprofits
in the news are more likely to respond generously.
Over 2025, 41% of people were able to name a recent disaster or crisis event in the news, an increase of 2.7% over the previous year. About a quarter of these people responded to their named top-of-mind event with generosity, and another 42% aspired to do so. Only a third of that 41% opted to not take action.

Crisis response rates jumped in Q4, rising to 31.6% of aware respondents, up from 21–25% across the first three quarters.
| Period | % Aware of Crisis | % of Aware Who Responded |
|---|---|---|
| Q1, 2025 (n=1,296) | 50.0% | 24.8% |
| Q2, 2025 (n=1,305) | 36.9% | 21.4% |
| Q3, 2025 (n=1,356) | 42.6% | 23.4% |
| Q4, 2025 (n=1,352) | 36.3% | 31.6% |
| Overall, 2025 (n=5,309) | 41.4% | 25.2% |
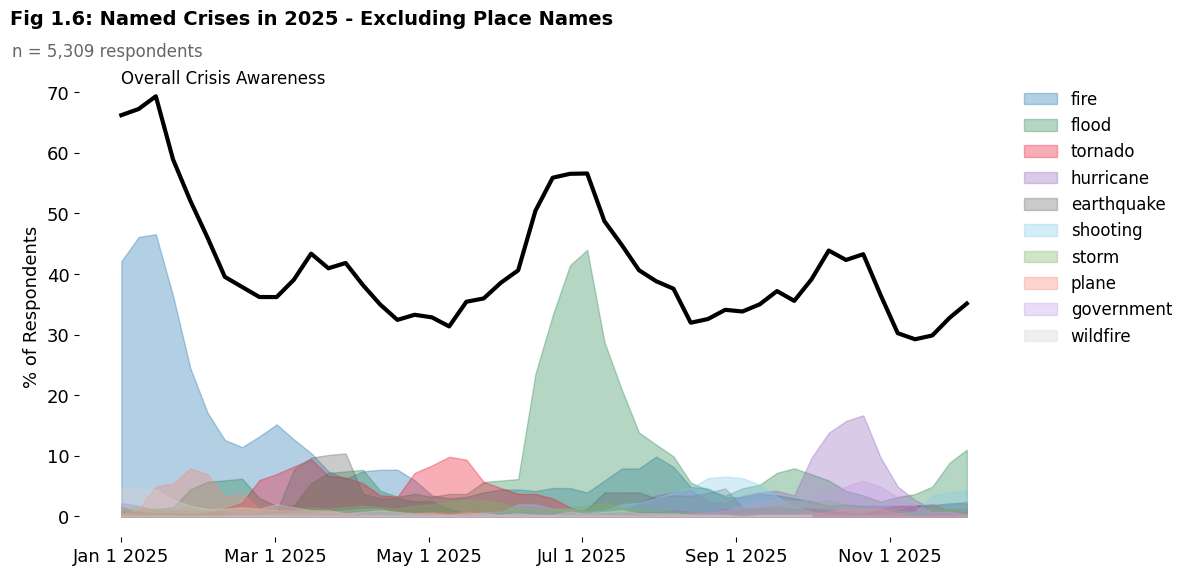
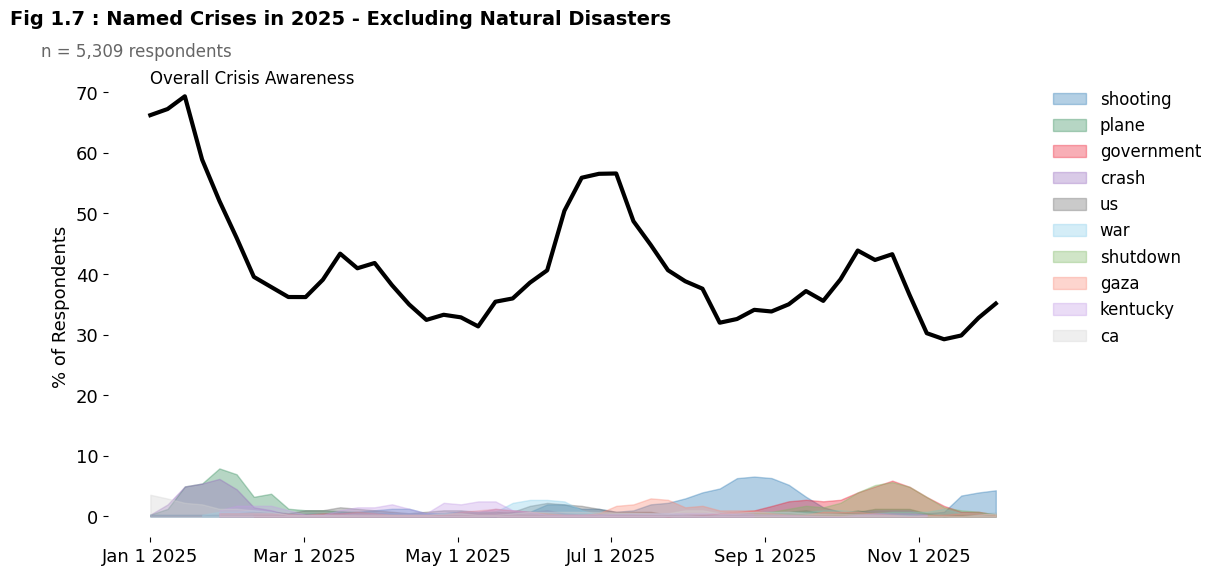
We asked people to describe any current event that would require support. Among these, natural disasters were the most frequently named events, with the Los Angeles wildfire (January) and the Texas floods (July) leading the way. If we examine non-natural disaster events, we see “shootings” appear for the first time. The US federal government shutdown in October was also named as one of the most noted events of 2025.
The solid black line shows the percent who were able to name an event throughout the year.
Nonprofit news awareness grew slightly in 2025, and the relationship between awareness and action was consistent across every type of news. Regardless of whether what people heard about a nonprofit was positive, negative, or tied to a specific crisis, those who heard anything were more likely to give across every form of giving measured. We observed a similar finding in 2024. In 2025, we found that:
Crisis-aware respondents gave at a 13-point higher rate than those unaware (73.4% vs. 59.8%), with similar gaps for money, items, and volunteering.
Exposure to negative charity news was associated with more giving, not less — 80.3% of those who heard something negative gave, compared to 63.7% who hadn't.
83.9% of those who heard recent positive news gave, compared to 54.9% who hadn't heard anything positive about an organization recently.
The negative news finding is counterintuitive, as one might expect negative press to suppress giving. Our survey cannot establish causation, but several explanations are possible. People who closely follow nonprofit news may simply be more civically engaged to begin with, or people who already give may be more attuned to charity-related stories, positive and negative alike. Other engagement questions in our survey support the first explanation: respondents who recalled nonprofit news stories also scored higher on measures of community involvement and social awareness, suggesting that attention to the nonprofit sector is itself a signal of broader civic engagement.
| Nonprofit News Awareness | 2025 (n=5,445) |
YOY Change (2025 − 2024) |
|---|---|---|
| Aware of nonprofits in the news (positive or negative) | 40.2% | +4.1 pp |
| Recently heard something negative | 10.4% | +1.3 pp |
| Recently heard something positive | 36.4% | +3.4 pp |
How generosity affects perceptions of financial strain
Over the past two years, the fraction of people who say that giving puts a financial strain on them is essentially unchanged, at 46%. The stability of this measure is of note given what some commentators have noted about perceived economic disruption in the US population. Although our survey cannot establish a direct link to giving behavior, we note that monetary donations have also been resilient over that timeframe.
A larger fraction of people who had not given money recently perceived financial strain than those who had given. About 50% of non-money-givers felt that giving put a financial strain on them, compared to 40% of those who gave money.
We also ask people if they expect to give the same, less, or more in the coming year. The overall trend was that, on balance, the population gave at about the same rate in 2025 as they did in 2024.
Recent givers were more likely to anticipate giving less, possibly reflecting greater awareness of their financial limits.
Our sample showed some shifts in self-reported income and disposable income over the last two years. See our appendix for a deeper analysis of how these changes relate to one's political lean.
We estimated what percentage of household income people gave to charity last year. Approximately one-third of all people gave 0.5% of their income to charity. By contrast, around 2% of the population gave at least 10% of their income to charity. People who identify as "very religious" tend to give about 50% more (as a relative increase) than the general population; 3.1% of the very religious donated at least 10% of their income in 2025, compared to 2.0% of the general population. See our appendix for tables for a more detailed breakdown of generosity by income.
Using self-reported income and giving amounts, we estimated relative contribution levels across the sample. Expressing giving as a share of household income allows for some comparison across respondents at different income levels. Compared to 2023, a slightly smaller share of respondents appear to be giving at equivalent rates in 2024 and 2025, but the rates are relatively similar overall. Appendix Table A1 illustrates this trend over the past three years. A similar, parallel trend also exists for highly religious people in Appendix Table A2.
These estimates carry inherent limitations. Charitable giving amounts are self-reported and rely on 12-month retrospective recall, which is subject to memory error and social desirability bias. Results should be interpreted as indicative rather than precise. This measure does not account for relevant differences in generational wealth, accrued assets, or household size.

PART 2: The social fabric
Trust, community belonging, depolarization, and prosociality
Trust in community
| Statement | 2024 | 2025 | YOY Change |
|---|---|---|---|
| Trust nonprofits | 71.6% | 71.1% | -0.5 pp |
| Trust people | 59.6% | 60.1% | +0.5 pp |
| Trust media sources | N/A | 24.1% | — |
Looking at our measure of trust in the formal nonprofit sector, 71% trust nonprofits and the services they provide. This figure was relatively consistent with 2024 results.
In 2025, we began asking people about trust in their preferred media sources, and the results suggest a lower level of trust. After identifying the sources of news they prefer, only a quarter of people said they trusted those preferred media sources "mostly" or "very much."
When these measures of trust are compared against each other, we consistently see that nonprofits are trusted by most people, slightly ahead of the belief that other people can generally be trusted. By contrast, trust in one's preferred news media or Internet sources lags far behind.
In 2025, a majority of people in our annual sample said that, in general, most people can be trusted. While other surveys measuring trust show that various measures of trust in institutions have been in decline over recent decades, a majority of GivingPulse respondents still report trust in other people.
Community belonging
We included four questions from the 2024 Belonging Barometer about community belonging in our weekly 2025 GivingPulse surveys in order to understand how community and civic engagement correlate with a sense of belonging. While three-quarters of people report feeling welcomed and included, a more complex picture emerges looking at other measures.
Only a third of respondents report a genuinely rooted sense of community belonging, while a majority sit in more ambiguous territory, neither disconnected nor truly embedded. The proportion of people who felt an ambiguous relationship with their community was similar to findings from other research in 2024.
That complexity is further reflected in the fact that one-third of respondents report feeling unable to be their authentic selves in their communities.
These patterns held broadly consistent with 2024 results and showed no dramatic shifts over the 18-month period we tracked; we will revisit this with a longer timeframe in 2027.
Why does this matter? Respondents with a genuine sense of community belonging are more likely to trust other people and to have participated in a generous act. They are also more likely to have recently given in some form, and more likely to have been recently solicited. This suggests that people who feel more embedded in community are also more plugged in to the networks that connect would-be supporters to causes they care about.
Respondents who experience giving as financially stressful, who feel pressured to give, or give out of guilt, all tend to report less community belonging. These three dynamics have been interrelated in our data for several years: guilt over one's good fortune tends to cluster with feelings of social pressure, a sense of religious duty, and receptivity to others' advice on giving. Further research could explore the extent to which community belonging shares these pressures, or is shaped by them.
| Statement | Category | 2024 | 2025 | YOY Change |
|---|---|---|---|---|
| I am welcomed and included in my community | Welcoming community | 75.0% | 76.7% | +1.7 pp |
| I feel like I truly belong | Welcomed by others | 69.9% | 72.5% | +2.6 pp |
| I cannot be my authentic self | Not accepted | 37.3% | 36.7% | -0.6 pp |
| I am treated as "less than" | Treated less than | 22.5% | 24.2% | +1.7 pp |
| Percentage of population that fits into each belonging category | ||||
| Sense of Belonging (overall) | Community Belonging Overall | 33.5% | 33.7% | +0.2 pp |
| Exclusion / ambiguous belonging | Community Belonging Overall | 66.4% | 66.3% | -0.1 pp |
71%
trust formal nonprofits and the services they provide.
33%
of respondents report a genuinely rooted sense of
community belonging
79%
agree that they support others regardless of differing beliefs, politics, or lifestyles.
Attitudes around generosity and polarization
The GivingPulse survey probes the boundaries of people's willingness to support others beyond those they agree with. Since these questions were introduced in Q3 2024, the picture is one of genuine openness.
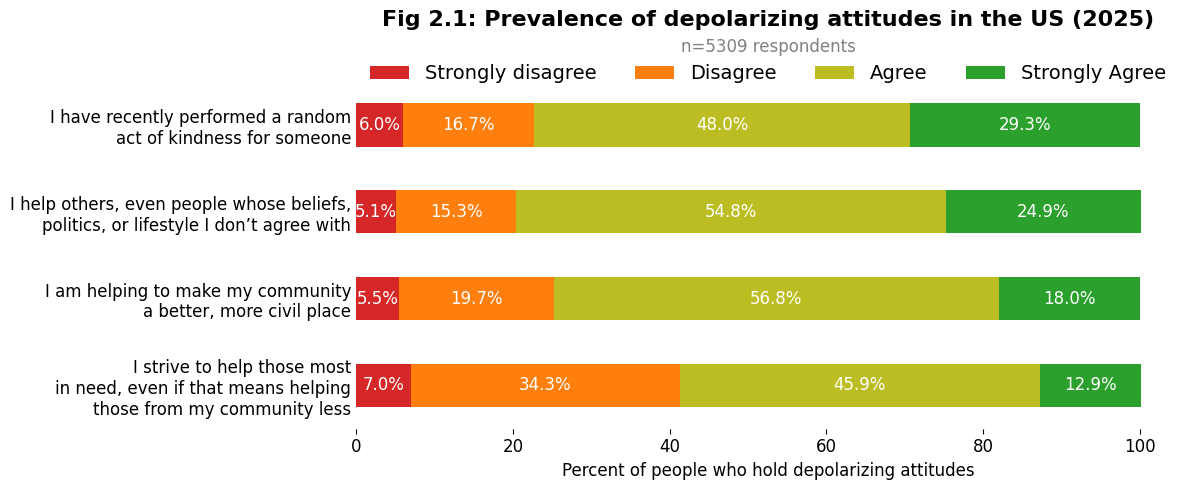
As shown in Figure 2.1, helping across differences is broadly embraced. An overwhelming majority agree that they support others regardless of differing beliefs, politics, or lifestyles. A comparable share feels personally invested in civic life, and believes their actions contribute to a better, more civil community. Random acts of kindness reflect a similar pattern.
The sharpest divergence appears when the questions are framed around tradeoffs. When helping those in need is perceived as coming at the expense of one’s own community, we see people’s convictions softening, with a meaningful minority of respondents disagreeing with those statements.
These attitudes are remarkably stable compared to 2024, with most measures shifting less than one percentage point year over year. The one exception is random acts of kindness, which saw a more notable increase. Scores also remain consistent across quarters throughout the year, with variations generally limited to a narrow range.
Civic intent and prosociality
We track 14 measures of prosocial behavior and attitudes that are used to create a composite score we call Civic Intent. It combines recent acts of generosity, depolarizing views, community/worldly awareness, and trust, into a score that indexes the prevalence of people helping (or desiring to help) others in the US.
As shown in Figure 2.2, six component questions encapsulate the range of attitudes that affect a person's likelihood to act. The floor is simply believing that at least one of your recent acts of generosity was meaningful to them personally; an overwhelming majority feel this way. At the other end, the most engaged members of the population are those who actively initiated something to help others in their community within the past week, a bar that only a small minority of respondents clear. The other measures — including trust in nonprofits, trust in people generally, expectations of future giving, and a personal sense of obligation to help those in need — fill in the spectrum between those two poles.

Community perceptions about others' generosity
Geographic variation
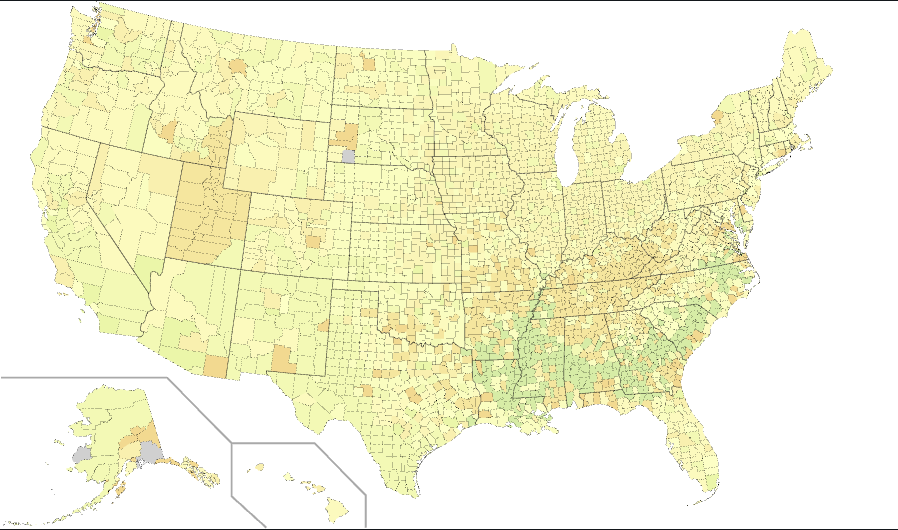
We converted these questions into a community perception score on a 0–100 scale — measuring how much people believe others around them are willing to help — and then compared those scores across US community types using the American Community Project model. As shown in the figure, scores remain uniformly high across all county types, suggesting that positive perceptions of others' generosity are broadly shared, regardless of geography or community character. The narrow range across all community types points to a rare area of consensus in an otherwise varied landscape. Predominantly rural and more religiously homogeneous community types fall at the lower end of that range, suggesting a somewhat different social dynamic in those counties, though the differences are modest rather than dramatic.


Beginning in Q2 2025, we expanded the survey beyond people’s own attitudes toward others to also ask how they thought most people in their community acted. Did others strive to make a difference in their community? Were they also willing to help anyone, even people they disagreed with?
We categorized people into groups based on how their self-perceptions aligned with their perceptions of others. A large majority both strive to build community themselves and believe others around them are doing the same. A smaller group feels alone in their generosity, and a minority are uninterested in community-building regardless of what they perceive others to be doing.
How a person perceives others' intentions appears to matter independently of their own commitment. Even among those less inclined to help, a greater proportion reported recently acting generously when they believed most people around them were also helping out. This "perception effect" — how perceiving generosity yields more of it — is associated with more generosity among both already-committed and less-inclined helpers alike. We explored this dynamic in greater detail in a recent blog post.
Appendix
About the sample
The total sample size is n = 5,445, including responses collected throughout 2025 and a small number from early January 2026 in order to fully capture end-of-year giving.
For analyses restricted to the 2025 calendar year, the sample is n = 5,307, excluding responses collected in early 2026.
For questions with a recall period (e.g., “in the last seven days”), the full sample (n = 5,445) is used. As a result, a small number of responses may reflect activity occurring in early 2026, depending on the timing of survey completion.
These differences are meant to provide the most accurate snapshot of the calendar year in the context of each question we ask.
| % of income given to charity | 2023 (n=9,342) | 2024 (n=6,301) | 2025 (n=5,309) |
|---|---|---|---|
| > 0.5% | 36.7% | 34.6% | 34.3% |
| > 1% | 22.9% | 22.4% | 22.8% |
| > 2% | 11.7% | 11.0% | 11.0% |
| > 3% | 9.0% | 7.8% | 7.4% |
| > 4% | 5.1% | 4.2% | 4.4% |
| > 5% | 5.1% | 4.2% | 4.4% |
| > 7% | 3.9% | 3.1% | 3.0% |
| > 10% | 2.4% | 1.8% | 2.0% |
| > 20% | 1.1% | 0.7% | 0.8% |
Pew Research, the Philanthropy Roundtable, and researchers find that highly religious people tend to give more to charity. We also find a similar trend: A larger percentage of people who describe themselves as "very religious" give more of their income to charity. This likely does not merely represent church support. In a previous year, we included a clarifying question where we asked people whether they had included any activities with money to a church in their generosity; we found that only half of highly religious people defaulted to including this in their responses, when not prompted.
| % of income given to charity | 2023 (n=2,829) | 2024 (n=1,539) | 2025 (n=1,305) |
|---|---|---|---|
| > 0.5% | 46.5% | 44.1% | 44.7% |
| > 1% | 32.5% | 30.6% | 31.8% |
| > 2% | 18.7% | 17.9% | 16.8% |
| > 3% | 14.8% | 13.1% | 12.6% |
| > 4% | 8.8% | 7.4% | 7.4% |
| > 5% | 8.8% | 7.4% | 7.4% |
| > 7% | 6.9% | 5.7% | 5.1% |
| > 10% | 4.4% | 3.0% | 3.1% |
| > 20% | 1.7% | 0.8% | 0.8% |
Methodology
Data were collected across four quarterly waves of the 2025 Generosity Panel, yielding a total sample of 5,309 US adults. Respondents were recruited to meet quotas on gender, age, and state of residence to approximate a nationally representative sample.
The community perception score is a composite derived from three items in the attitude questions (Question 31). Respondents were asked how much they agreed or disagreed with the following statements:
Most people I know believe they can make a difference in their community;
I believe others in my community are willing to help people whose beliefs, politics, or lifestyle they don't agree with; and
I feel like I am able to make a difference in my community.
Each item was measured on a four-point scale from 1 (Strongly Disagree) to 4 (Strongly Agree). A raw mean was computed across the three items and then normalised to a 0–100 scale, (where 0 = strongly disagree and 100 = strongly agree) across all items. See our post about the Perception Effect for more details.
Demographics
The 2025 Generosity Panel sample comprised 5,309 US adults.
The sample skewed toward middle-aged and older respondents: those aged 50–64 were the largest age group (25%), followed by 40–49 year-olds (25%) and 65–85 year-olds (21%). Younger adults aged 18–29 collectively made up about 18% of the sample. The gender split was nearly even.
Two-thirds of respondents (68%) had no children currently living at home. On religiosity, roughly half described themselves as somewhat religious (45%), with the remainder split between not at all religious (31%) and very religious (25%).
The sample was predominantly Caucasian/White (74%), with African American respondents as the next largest group (13%), followed by Hispanic/Latino (5%) and Asian (5%) respondents. All other ethnic groups each represented less than 2% of the sample.
In terms of employment, the private sector was the dominant employment context (59%), followed by government (19%), self-employment (12%), and nonprofit organizations (10%). Disposable income was difficult to characterize cleanly, given high rates of missing and uncertain responses (26% NaN, 8% unsure); among those who responded, the largest share reported disposable income under $5,000 annually (21%).
See our supplementary data for tables.