

Generosity and
Civic Intent in Early 2025
A holistic look at trends in giving behavior and perspectives in the U.S.

About the survey
Since 2022, GivingTuesday has conducted a weekly cross-sectional online survey of Americans that tracks generous actions in the past week and their associated attitudes and worldview. These findings relate to the year of 2024, and build on findings we’ve been publishing on a quarterly basis throughout the year. We have prepared an accompanying methodological note for all figures outlined here.
Key Takeaways: What We’re Learning in this Release
GivingPulse survey data is providing a preliminary snapshot of how Americans are viewing each other and their place in their communities in early 2025.
Q1 2025 data shows that Civic Intent—a composite measure of trust, prosocial behavior, and community engagement—remains remarkably stable across geography and political worldview. In fact, since July 2024, including the US presidential inauguration period, Civic Intent scores have varied little nationwide, and show very little change across different categories of political worldview. Willingness to help others with different beliefs remains high, and a majority of people say they trust others.
However, a more nuanced picture emerges as we examine different political identities and measures. Those with center-oriented political views report having a lower sense of community belonging than those with more left or right leaning beliefs. About half of center-oriented respondents report they feel like they belong in their communities and 36% say they are treated as “less than”—a sharp increase from Q4 2024. Interestingly, feelings of being treated as “less than” have also grown among right leaning groups in this quarter.
Beyond beliefs and attitudes, for the first time we see some early divergence along political lines in monetary giving to nonprofits. In Q1 2025, rates of giving to formal nonprofits rose among right-leaning groups, in contrast to declines among left-leaning and centrist typologies. We are exploring potential relationships within the GivingPulse that would give clues for this observation. One possible explanation could be differing economic outlooks. In GivingPulse, we observe (as others have) that those with right-leaning views appear to have reacted more positively to recent economic shifts than others, increasing the value of their monetary giving by up to 60% in 2025 compared with Q3 and Q4 of 2024. On average, left- and right-leaning individuals said they gave approximately the same amount of money in the latter half of 2024. So far in 2025, right-leaning individuals reported giving 75% more dollars on average than left-leaning respondents. When looking at differences in future giving intentions, people with left and right-leaning political ideologies are equally as likely to report intentions to give the same value or more in the future, whereas people with centrist-leaning beliefs, are slightly more pessimistic — about a third intend to give less money in the next year, compared with 22-23% of the left- and right-leaning groups.
These findings suggest generous action is strongly correlated with a greater sense of belonging, and future research could explore how these effects interact. Opportunities remain for the social sector to motivate people of all political worldviews towards greater participation in generous action.
We will continue to monitor the data we’re capturing on these views over the course of this year.

To get the most out of this report, don’t forget to consult our available data resources.
Through Q1 2025, Civic Intent remains stable and reflects largely positive views and behaviors around community engagement
Civic Intent Overall
Civic Intent is our composite measure of 16 questions related to attitudes towards one's community, trust, beliefs, and recent generous action that encapsulates prosocial activity in a community-minded context (see our initial 2024 report for a detailed explanation). Since July of 2024, Civic Intent scores have remained stable, with minimal quarter-to-quarter changes. People have remarkably similar levels of Civic Intent in every part of the US, based on American Community Project's (ACP) county-types profiles: on a 0-100 scale, the range is 55-59. People also have remarkably similar levels of Civic Intent across political worldview, based on political types defined by Pew Research. The percentage of people with Civic Intent scores above 50 changed by less than 3 percent per Pew type over the past year (we compared those from Q3+Q4 2024 to those in Q1 2025). Civic Intent scores vary less around the country than does the frequency that people report having been last solicited, or how religious people say they are.
People have remarkably similar levels of Civic Intent in every part of the US, based on American Community Project's (ACP) county-types profiles. On a 0-100 scale, the range is 55-59.
Feelings of connection to community are high overall, with some differences by political ideology
Quarterly Trends

Comparing Q4 2024 and Q1 2025, a large majority of people still feel a sense of belonging in their communities. Across four questions measuring community belonging – ability to be one’s authentic self, feeling welcomed and included in activities, being treated as an equal, and feeling like one truly belongs in one’s community – 87% agree with at least two measures, and nearly two-thirds of people agree with three or more in Q1 2025¹.
At a national scale, levels of community belonging remain the same in the US when compared with Q4 2024. Across both time periods, 76% agree that they are welcomed and included in activities with others in their communities, and 74% of respondents agree that they are helping to make their communities better, more civil places. In tandem with feelings of belonging, trust and depolarization related attitudes have also remained consistent: from Q3 2024 to Q1 2025, 78% to 80% of people report a willingness to help others whose beliefs and politics differ from their own.
We also find that most people are willing to act generously across boundaries of worldview, helping those whose beliefs or politics they do not agree with. We asked people whether they agree or disagree with various statements about their willingness to be generous for the benefit of those outside their in-group, as well as their willingness to work towards greater civility. In Q1 2025 we find that 4 out of 5 people express agreement with statements around the importance of building community and increasing civility, similar to what we observed in 2024.
¹ Note that two of the four belonging questions are negatively worded so that yes means that a person feels less belonging: "treated as less than other residents" and "unable to be my whole self." Our analysis of the percent who felt belonging inverts the scales of negatively worded questions as necessary before calculating the percent who feeling they belong in their community. Questions are replicated from the 2024 Belonging Barometer.Differences across Political Worldviews
To assess differences across the political spectrum, we use the Pew Political Typology to categorize respondents into one of nine political orientations based on a person's worldview, as this tends to provide a more nuanced lens into a person's relationship to politics than asking about party affiliation or self-identifying liberal-to-conservative. In terms of political views, feelings of community belonging are lowest among people whose worldview skews neither left nor right – only around half of people in the center feel like they belong in their communities. People with more centrist views also report the highest levels of feeling like they are treated as “less than” by those around them, around 36%. This sentiment has increased since Q4 2024 by about 18%, and has increased by a similar margin among people with right-leaning views. Only left-leaning respondents remain unchanged in this regard.

76%
agree that they are welcomed and included in activities with others in their communities
74%
agree that they are helping to make their communities better, more civil places
80%
express agreement with statements around the importance of building community and increasing civility.
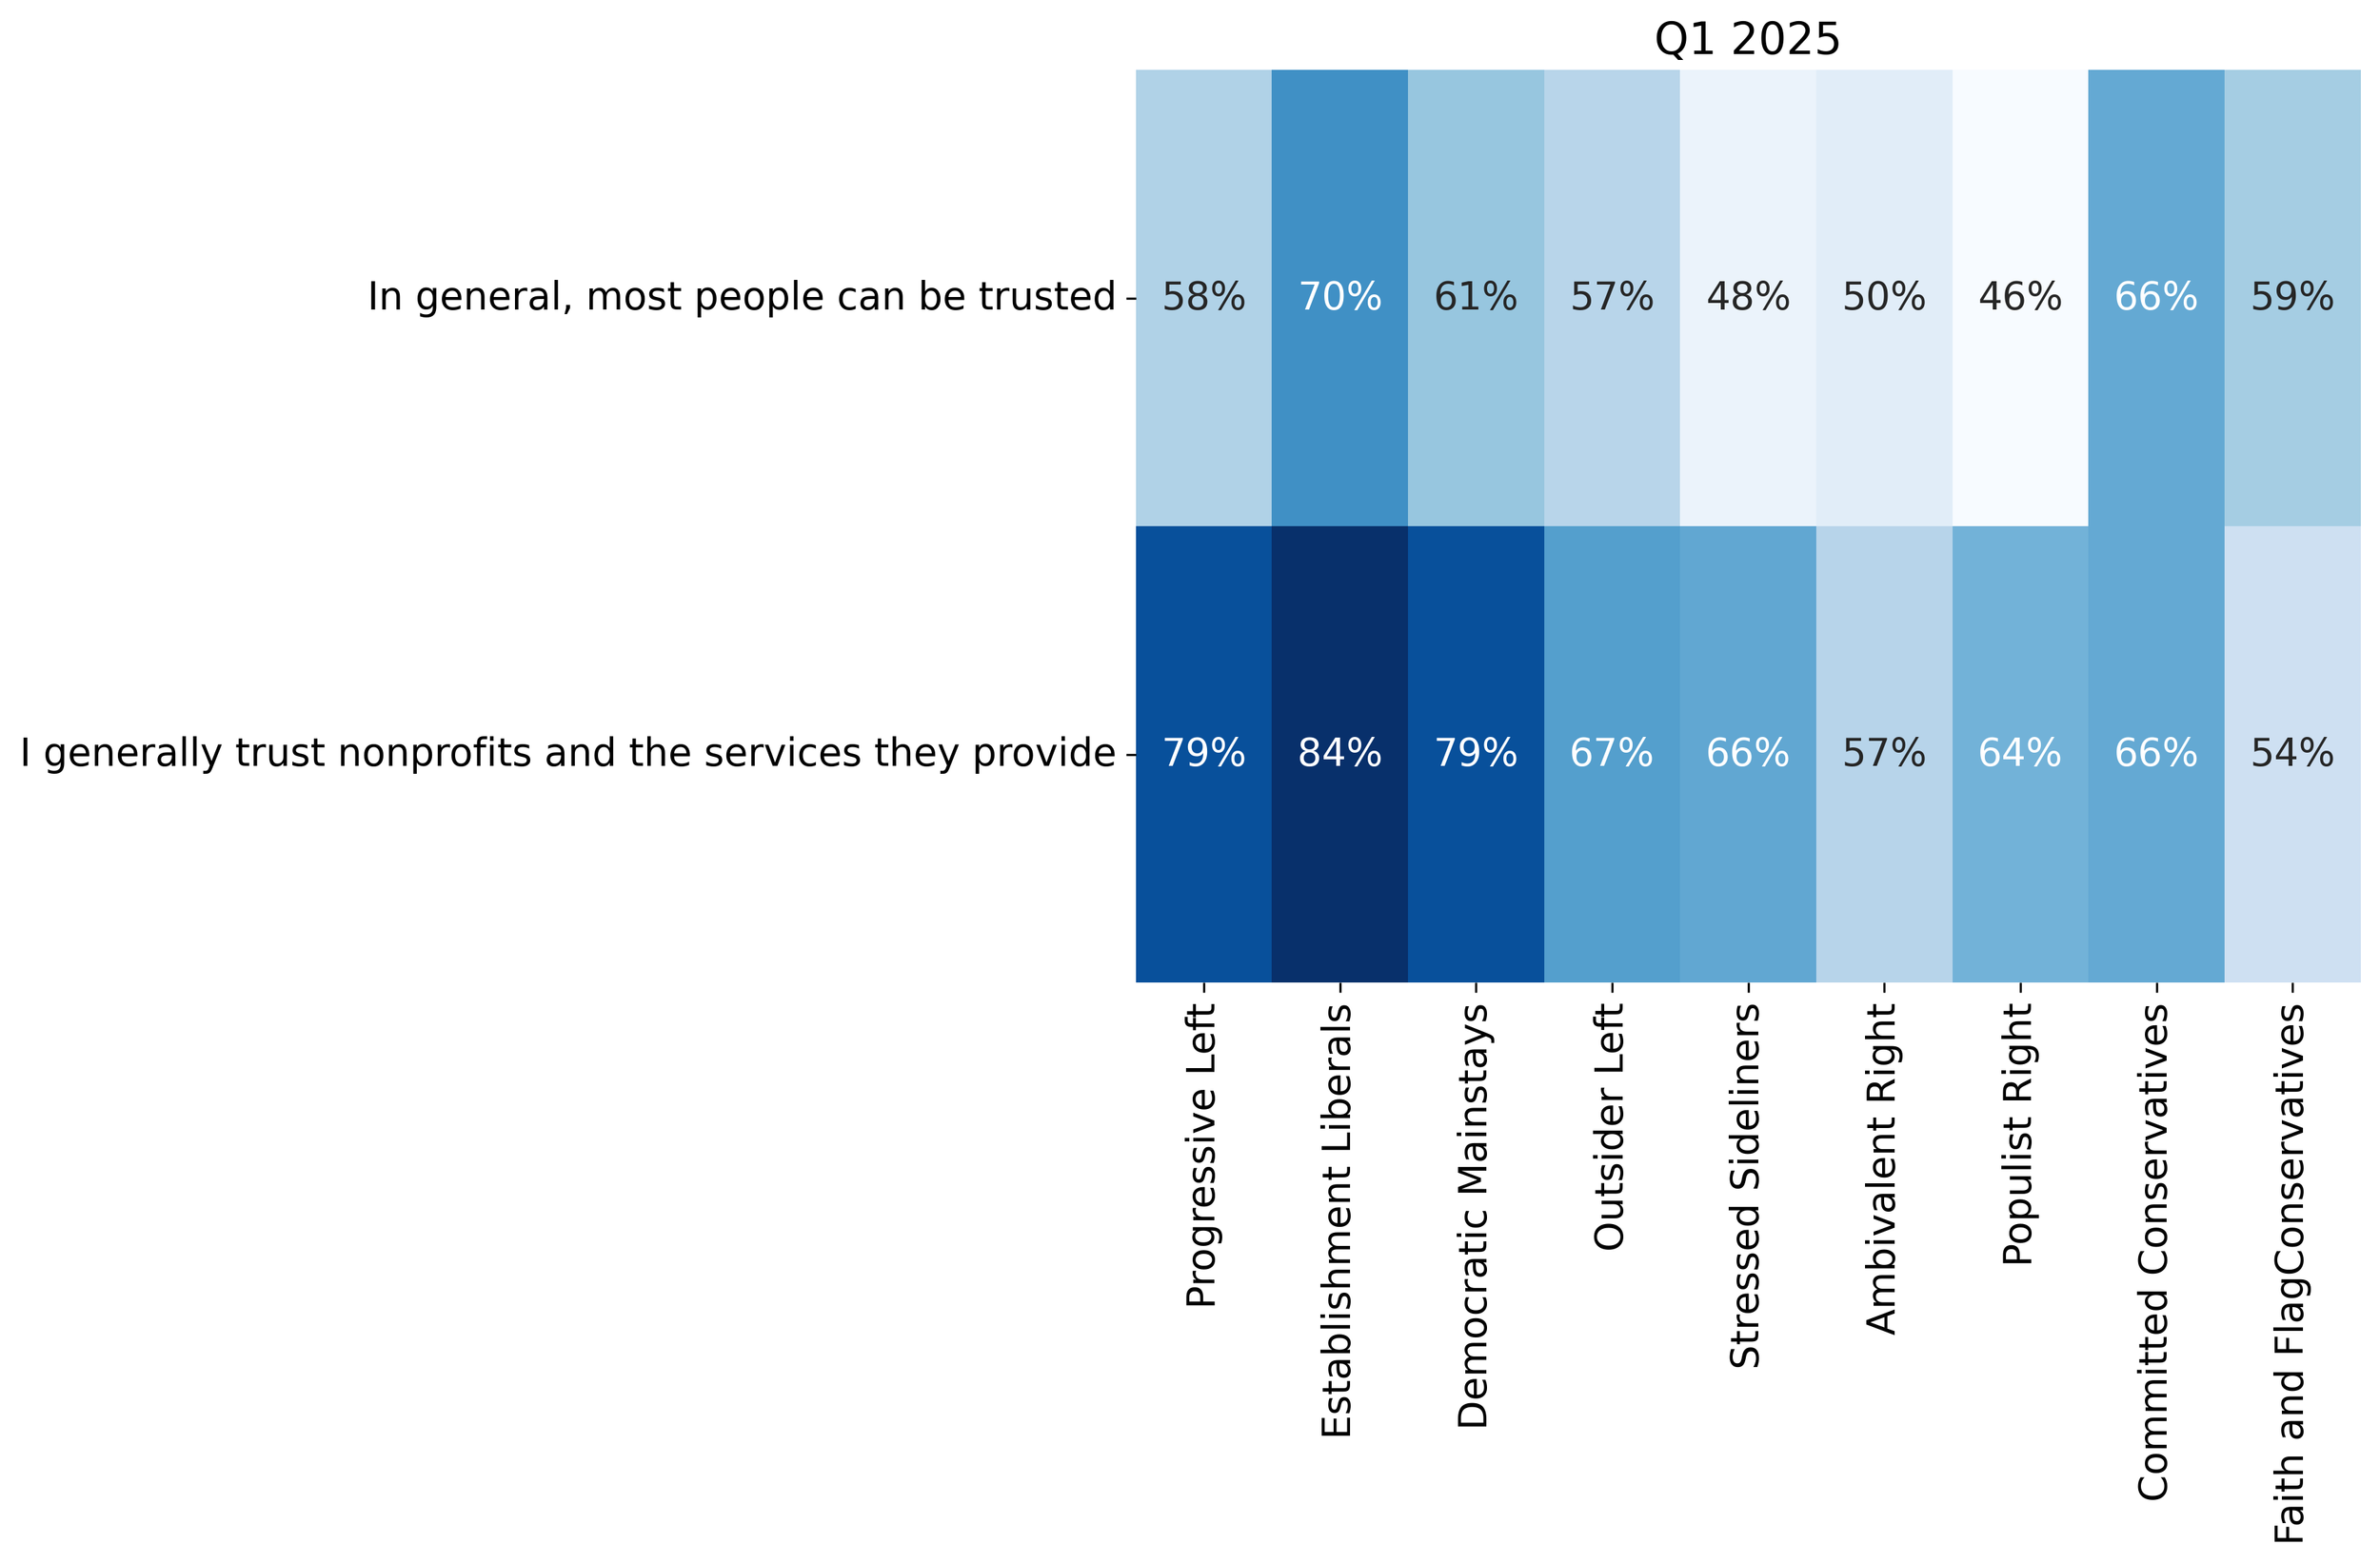
Trust in others remains strong
A consistent majority of Americans report generally trusting other people. Over the past year, this trust has remained largely stable, with no major quarter-over-quarter or year-over-year shifts. Politically, trust in others and in nonprofits remain higher on the left, though trust in others among left-leaning individuals has declined over previous quarters and is down 10% since Q3 2024. It is also lower among centrists generally speaking (unchanged compared with 2024), while trust in nonprofits has declined since Q4 2024.

Monetary Giving Shows Political Polarization for the First Time
2025 marks the first time we noticed monetary donation patterns differing based on contrasting political worldviews. Based on worldview, right-leaning groups increased their giving to registered organizations, while most other groups reported donating at lower rates. Those who identified with Faith and Flag Conservatives, Populist Right, and the Ambivalent Right all showed increased rates of giving by 43%-61%, compared to self-reported amounts in Q3 and Q4 of 2024. Meanwhile, all other groups reported decreased giving, with the Progressive Left, Stressed Sideliners, Democratic Mainstays and Committed Conservatives appearing to have substantially decreased giving rates, ranging from 25-51%.
Even though generosity trends in Q1 2025 appear to be stable overall, we are seeing signs that this stability is due to offsetting patterns. This divergence appears to be correlated with differing perceptions of the economy, and tariffs in particular, among political groups² ³.
Table: Percent change in dollars given to registered nonprofits per Pew group. Timeframe compares beginning of 2025 (Jan 1 through May 15)⁴ to self-reported dollars donated in Q3 and Q4 of 2024. Understanding percent change: If a group donated $100 in the past, +50% would be $150 and a -50% would be $50, respectively.
| Pew Political Type | Percent Change in Dollars to Registered Organizations |
|---|---|
| Faith and Flag Conservatives | 60.2 |
| Committed Conservatives | -30 |
| Populist Right | 49.6 |
| Ambivalent Right | 42.5 |
| Stressed Sideliners | -38.5 |
| Outsider Left | -10.1 |
| Democratic Mainstays | -25.3 |
| Establishment Liberals | -4 |
| Progressive Left | -51.2 |
Trust in others is associated with giving to registered nonprofits
Unsurprisingly, trust in others is highly positively correlated with community belonging, and prosociality broadly speaking, as does trust in nonprofit organizations. Trust is also associated with both recent generosity and future giving intentions. Across all the forms of giving that we measure, generally trusting other people is most strongly associated with giving money to registered nonprofits – those who are trusting are nearly twice as likely to have recently given money to a nonprofit than those who are not trusting (30% vs. 17% in Q1 2025). Additionally, trusting individuals are significantly more likely to report intentions to give the same or a higher amount of money in the next 12 months compared with the 12 months prior to being surveyed, while those who do not report trusting others are much more likely to want to reduce their amount contributed in the next year. This speaks to the link between trust and broader societal participation⁵, both as an actualized behavior and overall way of life, and the importance of trust in sustainable relationship building.

² For more on how political groups view tariffs, see Pew Research's April 2025 survey. In particular, Committed Conservatives favor free trade while the Populist Right is strongly anti-immigrant and protectionist.
³ Self-reported annual income for these groups has been relatively stable in our sample over the last year, so these shifts are not explained by changes in salary or disposable income. ⁴ We excluded 9 outliers (people who self-reported giving $3000 or more in the last 7 days) from these averages from our sample of N=2664 in 2024 and N=1957 in 2025. ⁵ The DoGood Institute reported on similar trends using the US Current Population Survey in 2024.